
VISUALIZATION &TRACKING are key to getting groups to collaborate, align and execute. Generally, we don't do it. Fortunately we have the conventional press who have the time and money to garner every possible detail from our leaders. Although President Obama himself might not analyze this Washington Post Online Article, there is countless information that he (and business leaders) could decipher, educate and ultimately change about the way they and their organization work. This is the future of analysis and proving collaboration success:
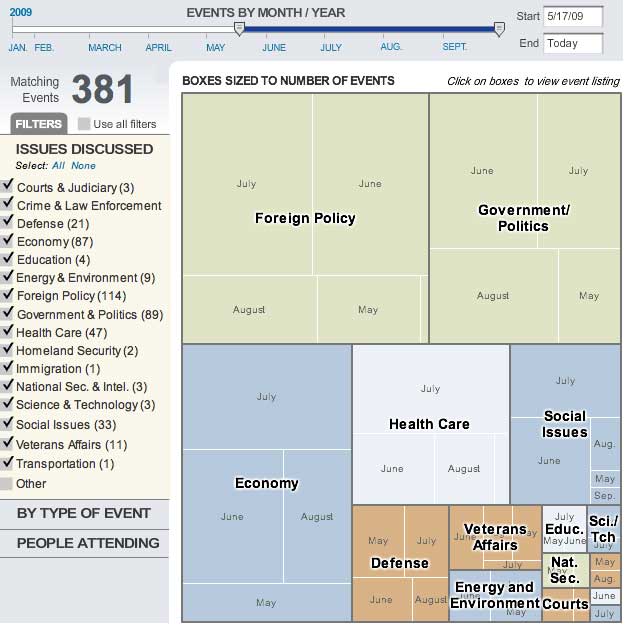
Track activity by Issues
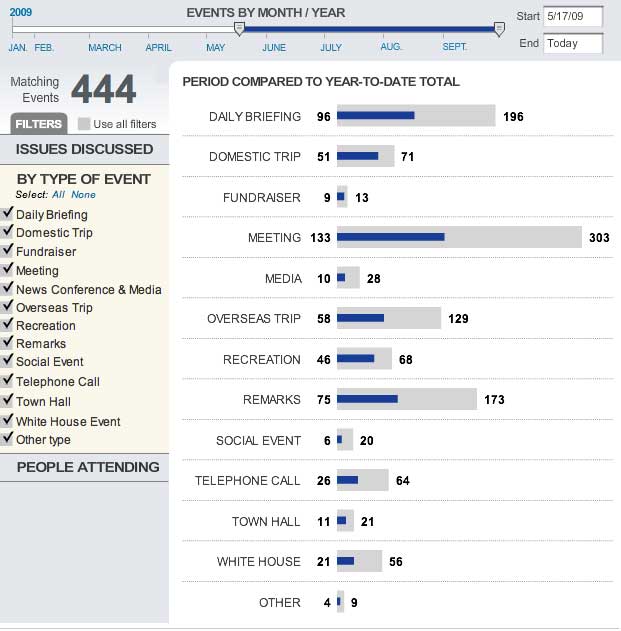
Track activity by Type of Event
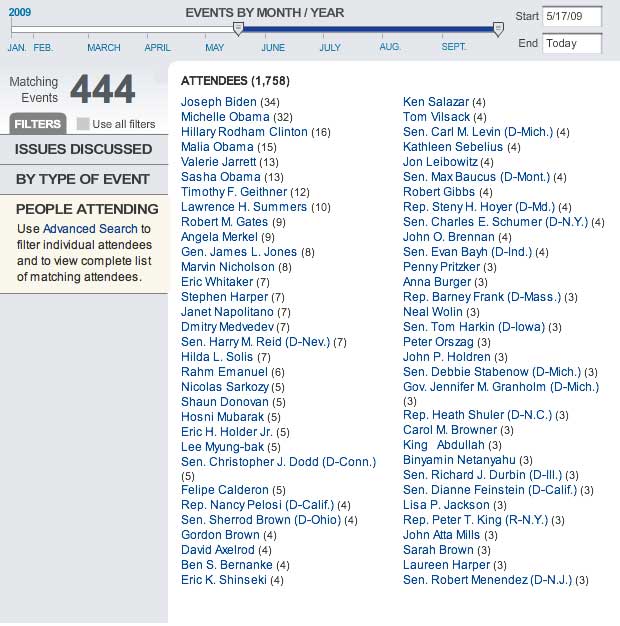
Track activity by People Attending
Solutions:
+ Track conference room time and attendees using Lotus, Exchange, Google Apps..
+ Track when your employees, friends, colleagues are mentioned online. Create a Google Alert.
+ Find employee activity by doing searches on Spock.com and Pipl.com (very comprehensive)
+ Use ANALYSIS of time tracking tools- two of the best for large companies Replicon and Time Mgt Software (complete list on Wikipedia) For smaller companies, use what is built into your collaboration software or try Harvest.
+ Visualize your data. Here are some options:![]() Thinkmap provides dynamic, data-driven visualization technology. Brilliant example of it in action.
Thinkmap provides dynamic, data-driven visualization technology. Brilliant example of it in action.

Minjet let you visualize everything from Word Document connections to people in Mind Map format.
Swivel: share your data, use others, visualize it all together.
Visual Complexity: view amazing visuals and get great ideas.
iA Web Trends map: one of the coolest visualizations of the internet ever made.
Akamai visualizes how internet traffic is being used.
And if you're adventurous, install this visualizer on your machine and you won't be disappointed: last.forward
But by far the best visualizer is the Gap Minder by Hans Rosling. Check out the TED video as well.